

Track Progress with Waterfall Chart Part 1
- November 2, 2022
- 0 replies
- 639 views
Display project burn up/down via a convenient Mashup Widget.
GUIDE CONCEPT
Long term projects need to be managed. As a project is scoped, requirements get defined and delivery-timeframes are estimated. As work is done, requirements are completed.
One way to track this project progress is with a Waterfall Chart.
This guide will show you how to utilize a Waterfall Chart Widget to easily display the project workflow.

YOU'LL LEARN HOW TO
- Create a Data Shape
- Create a Thing
- Create an Info Table Property
- Populate an Info Table with appropriate data for a Waterfall Chart
- Create a Mashup
- Utilize a Waterfall Chart to display project progress
Step 1: Create Data Shape
In this scenario, we'll store the Waterfall Chart's data in a Property type called an Info Table.
An Info Table is a spreadsheet-like Property, but in order to define the columns of the table, we first have to define a Data Shape. We'll do that in this step.
- In the left-side navigation, click Browse > Modeling > Data Shapes.
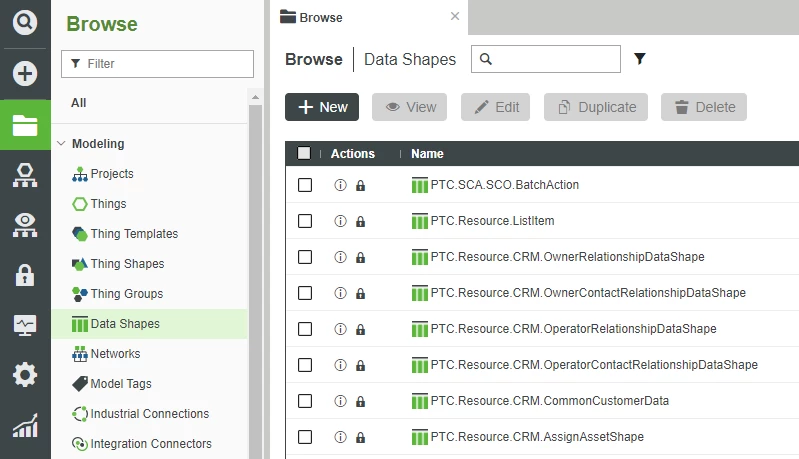
- At the top, click + New.
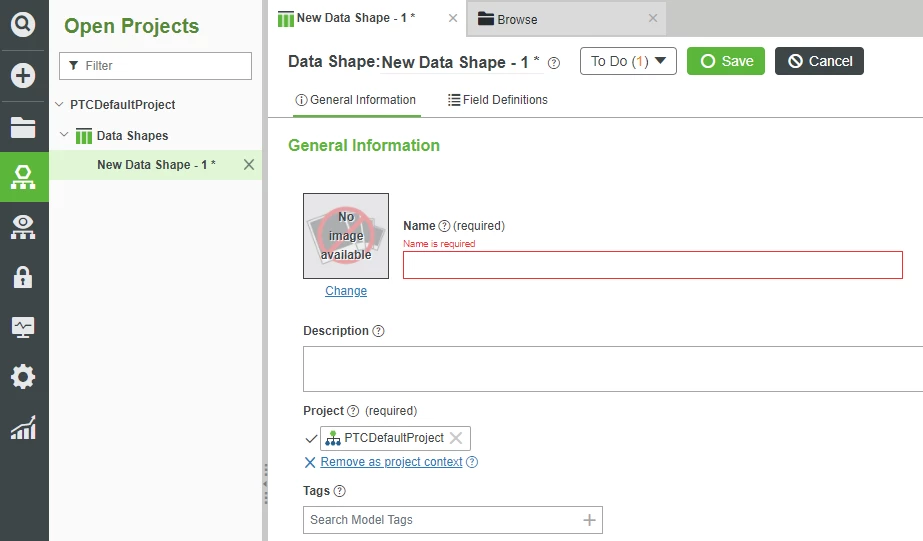
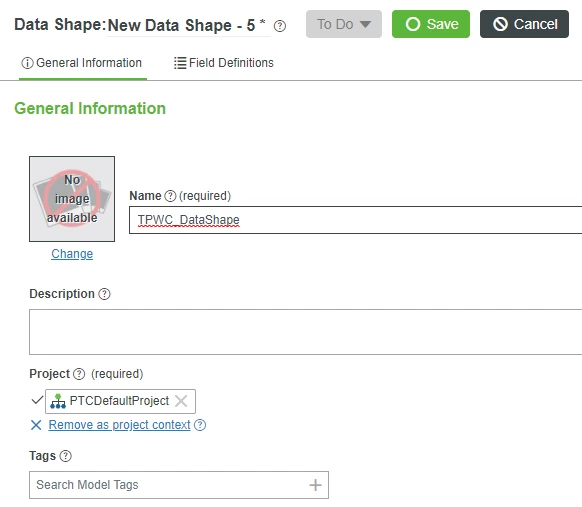
- In the Name field, type TPWC_DataShape.
- If Project is not already set, search for and select PTCDefaultProject
.
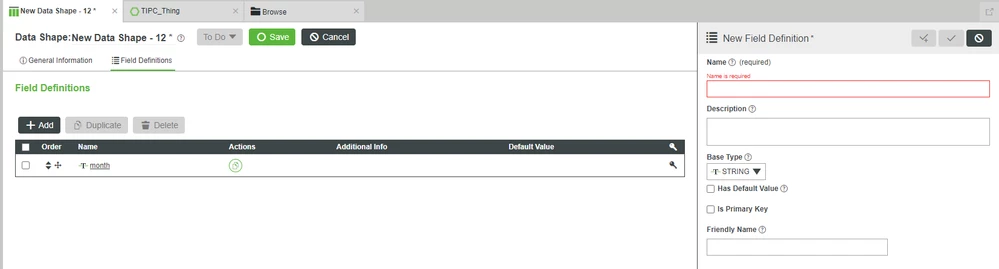
- At the top, click Field Definitions.
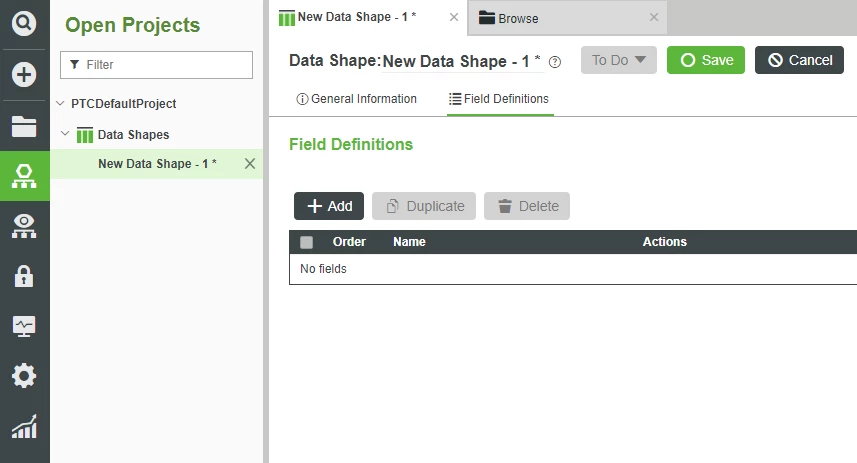
- At the top-left, click + Add.
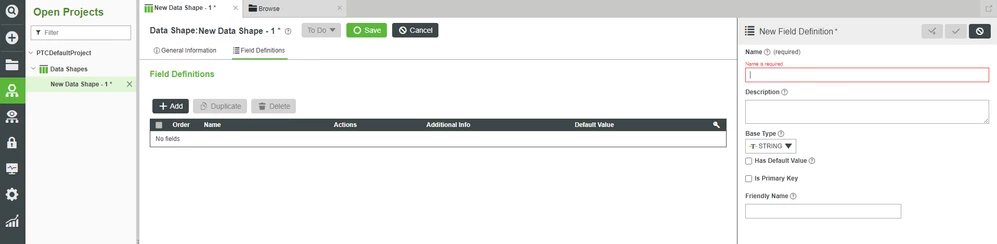
- On the right-side slide-out, in the Name field, type month.
- Note that you want to leave "Base Type" as the default of "STRING".
- Note that you want to leave "Base Type" as the default of "STRING".
- Check Is Primary Key.
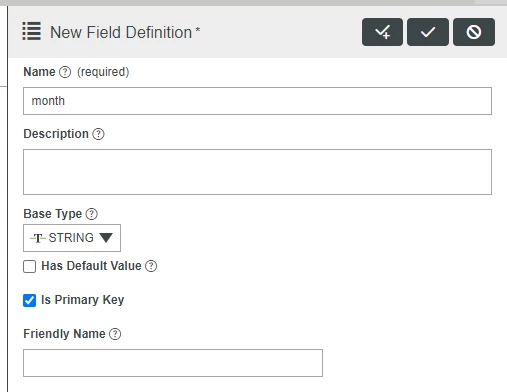
- Click the "check with a plus" button for Done and Add.
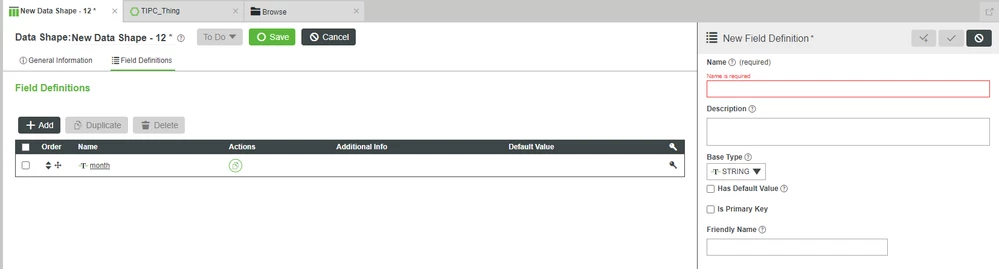
In the Name field, type amount.
- Change Base Type, to NUMBER.
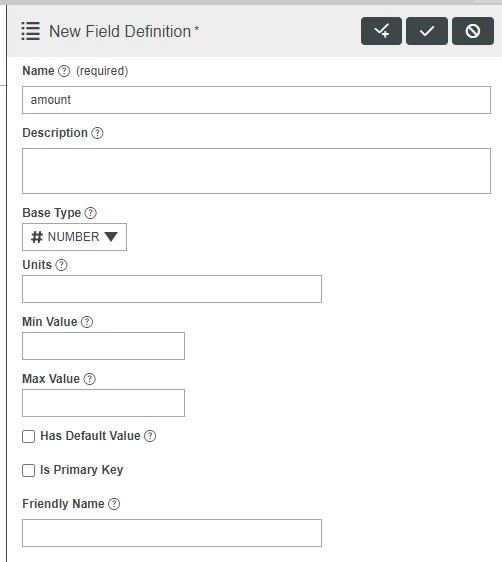
- Click the "check" button for Done.
- At the top, click Save
.
Step 2: Create Thing
Now that we have our Data Shape, we can create a Thing to document the project progress over time.
As already mentioned, we'll use an Info Table Property, formatted by the previously-created Data Shape, to do so.
- Click Browse > Modeling > Things.
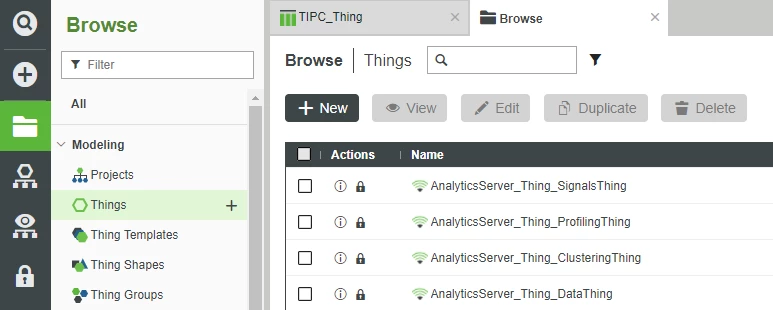
- Click + New.
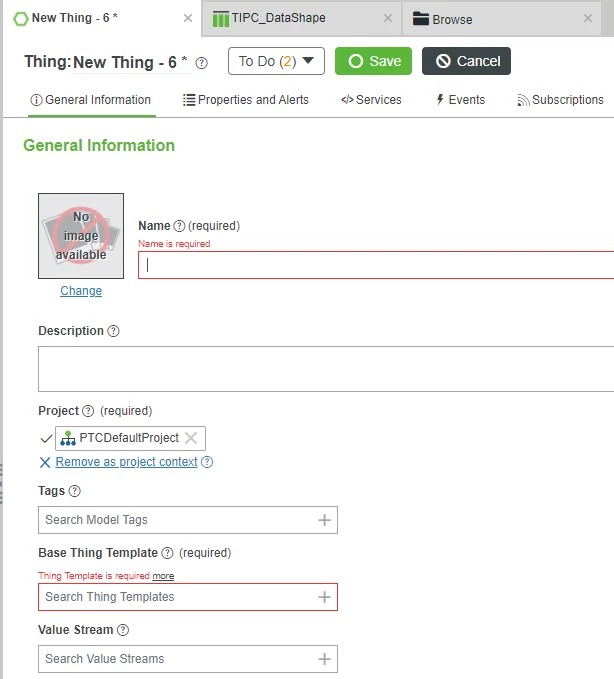
- In the Name field, type TPWC_Thing.
- If Project is not already set, search for and select PTCDefaultProject.
- In the Base Thing Template field, search for and select GenericThing.
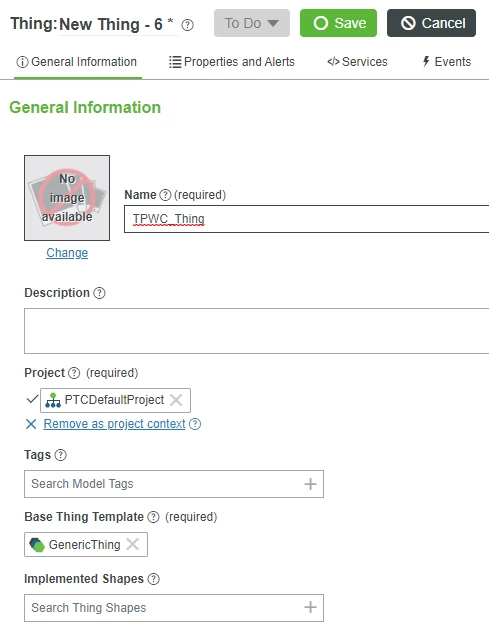
- At the top, click Save.
Add Info Table Property
Now that we have our Thing instantiated, we want to add an Info Table Property.
- At the top, click Properties and Alerts.
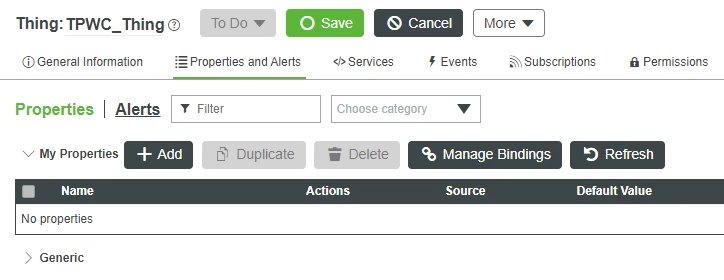
- Click + Add.
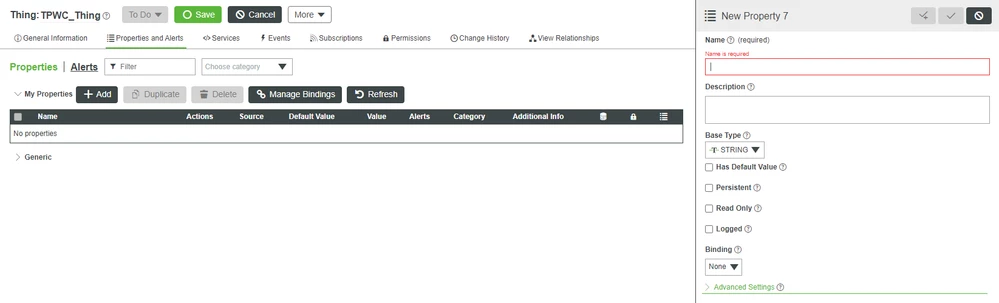
- On the right-side slide-out, in the Name field, type InfoTable_Property.
- Change Base Type to INFOTABLE.
- In the Data Shape field, search for and select TPWC_DataShape.
- Note that the Data Shape field will not appear until you set Base Type to INFOTABLE.
- Note that the Data Shape field will not appear until you set Base Type to INFOTABLE.
- Check Persistent.
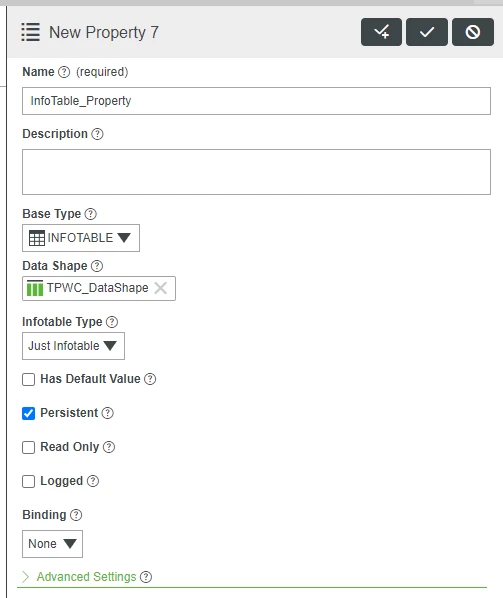
- At the top-right, click the "check" button for Done.
- At the top, click Save.
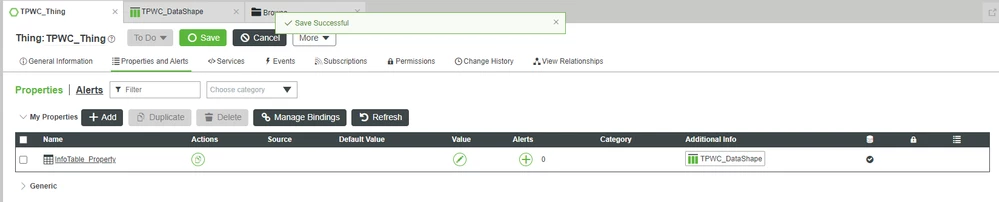
Set Value of Property
Now that we have a place in which to store spreadsheet-like values, we'll do so manually for testing.
- On the InfoTable_Property row, under the Value column, click the "pencil" icon for Set value of property.
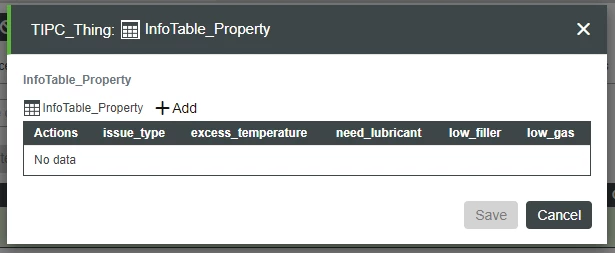
- On the pop-up, click + Add.
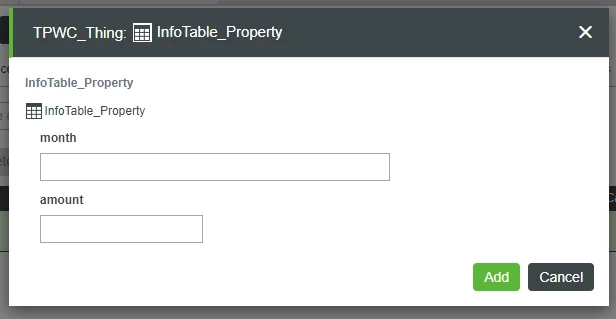
- Enter the following values in each field as per the table below:
Field Name Value month January amount 380 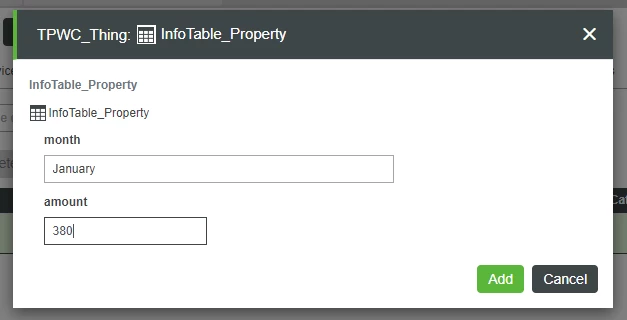
- Click Add.
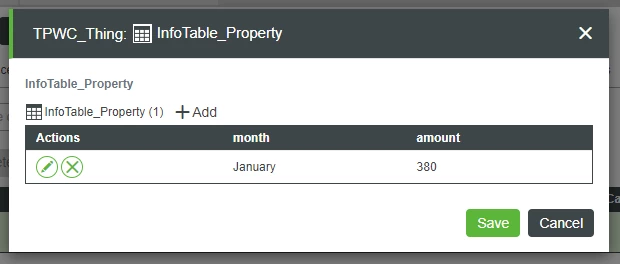
- Repeat Steps 2-4 multiples times until all of the below values have been entered.
- Note that amount should be left blank for both Mid-Term and Total.
- Note that you may enter fewer than all the values listed below if so desired, though your final Waterfall Chart will not match the following screenshots.
month amount February 85 March 50 April 1000 May -300 June 0 Mid-Term July 30 August -655 September -100 October -250 November 350 December -100 Total 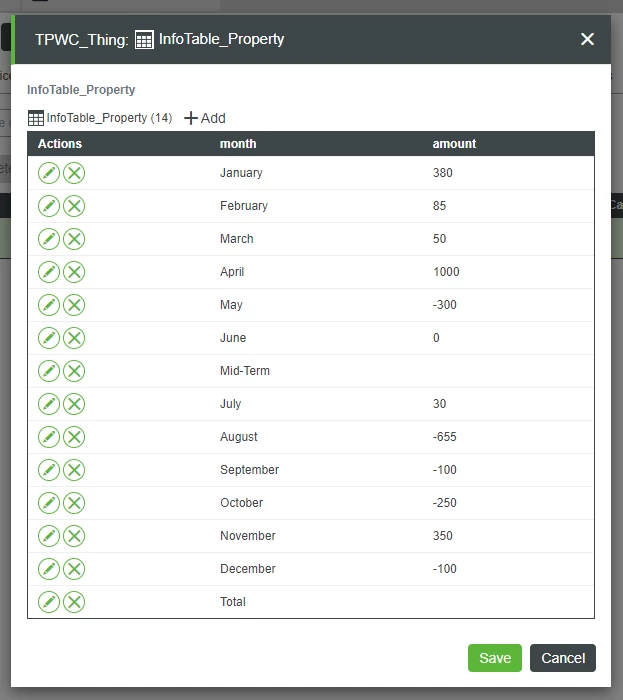
- On the pop-up, click Save.
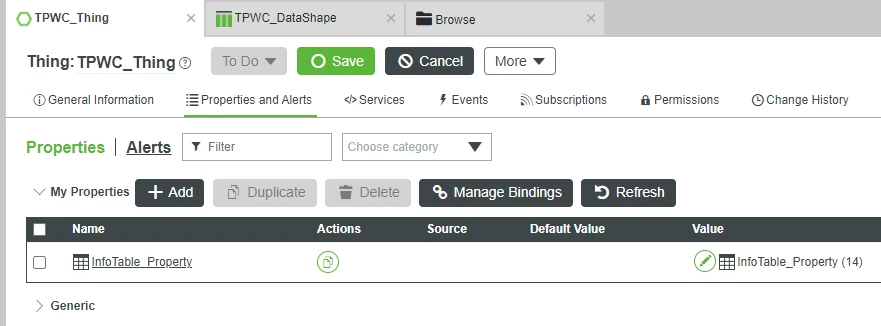
- At the top, click Save.
Step 3: Create Mashup
Now that we have our data in-place for testing (and could be connected to automated systems after we finish testing), we need to visualize the data.
As mentioned, we'll use a Waterfall Chart Widget, but first, we need to create a Mashup into which we can place the Widget.
- Click Browse > Visualization > Mashups.
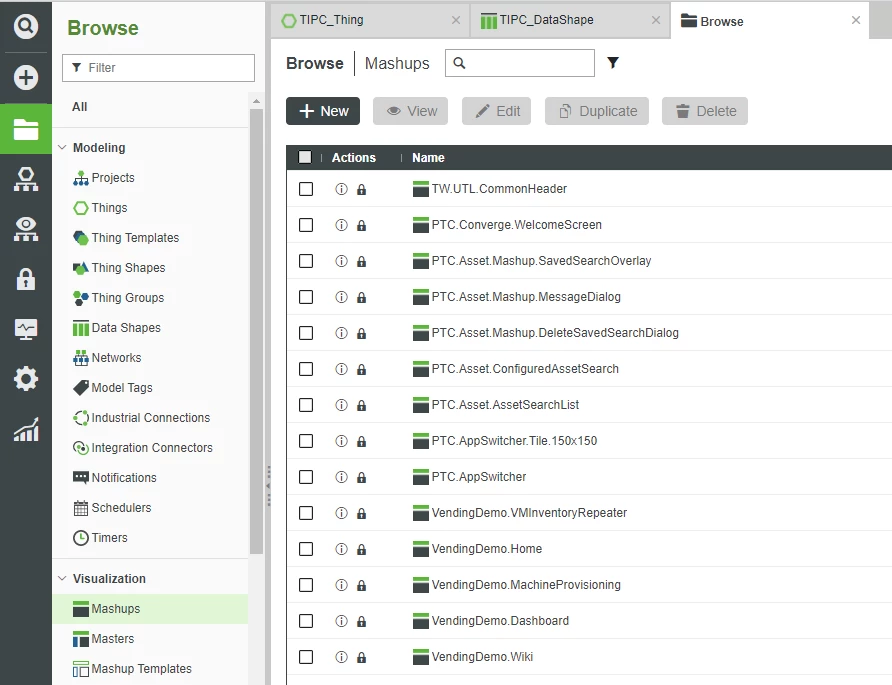
- Click + New.
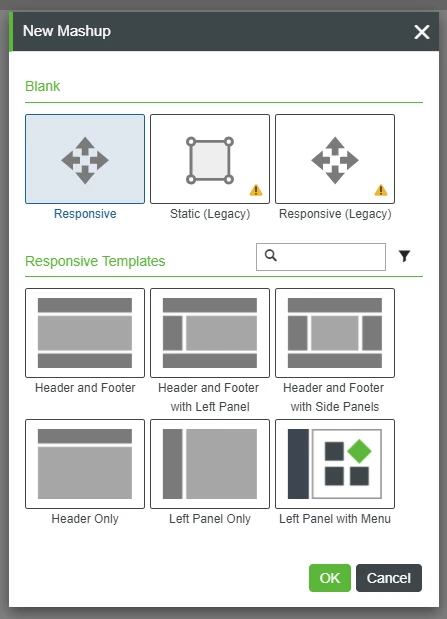
- Leave the defaults and click OK.
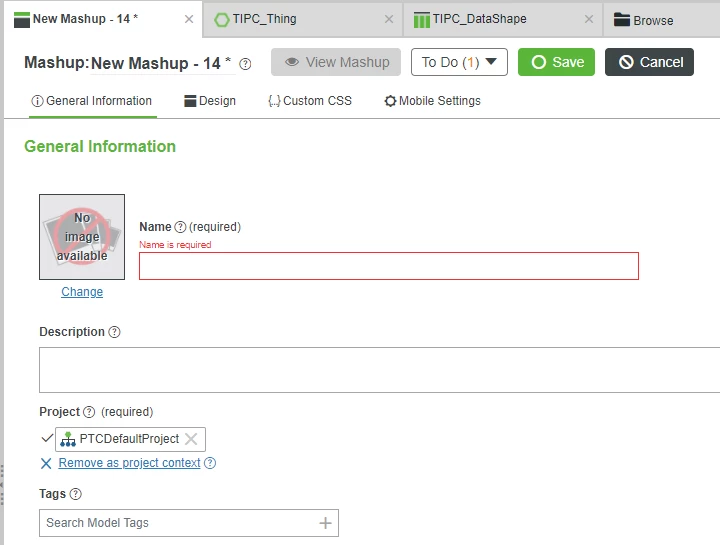
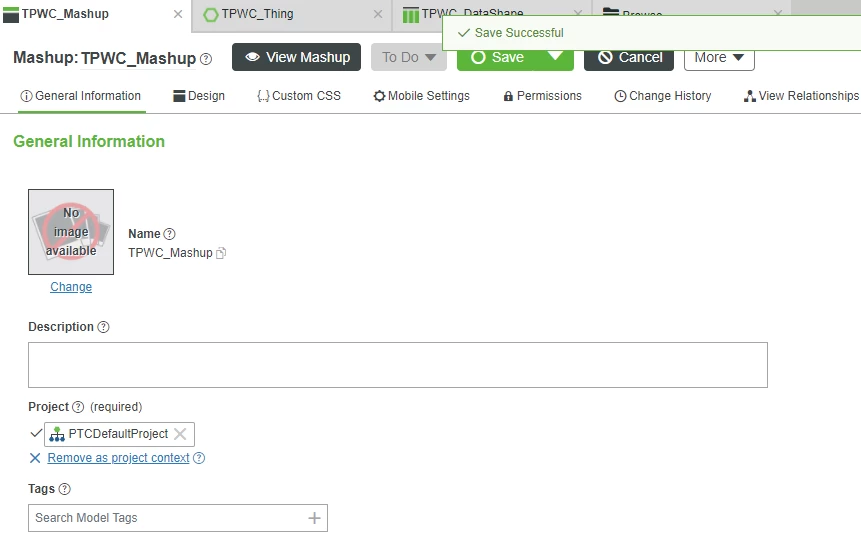
- In the Name field, type TPWC_Mashup.
- If Project is not already set, search for and select PTCDefaultProject.
- At the top, click Save.
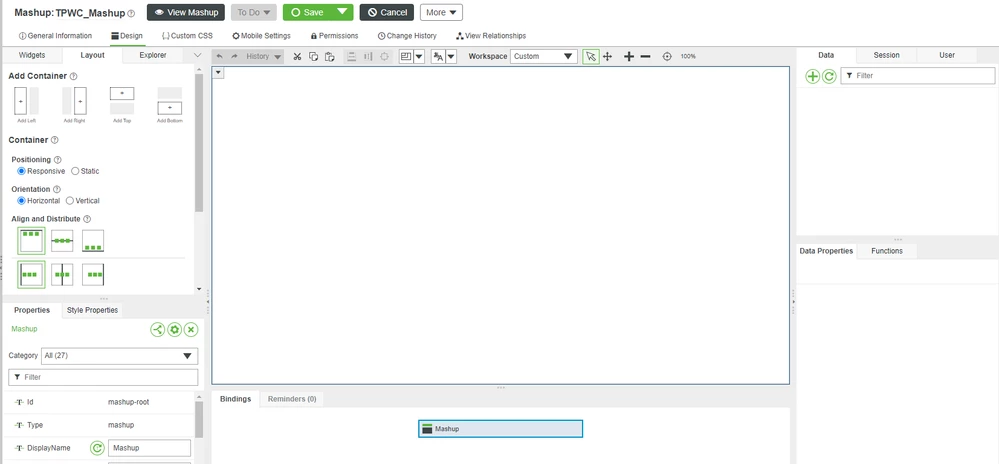
- At the top, click Design.
- At the top-left, click the Widgets tab.
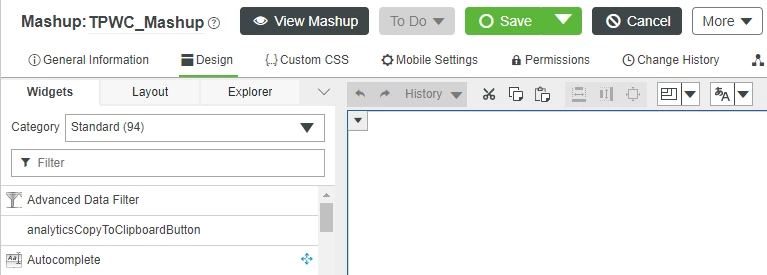
- Drag-and-drop a Waterfall Chart Widget onto the central Canvas.
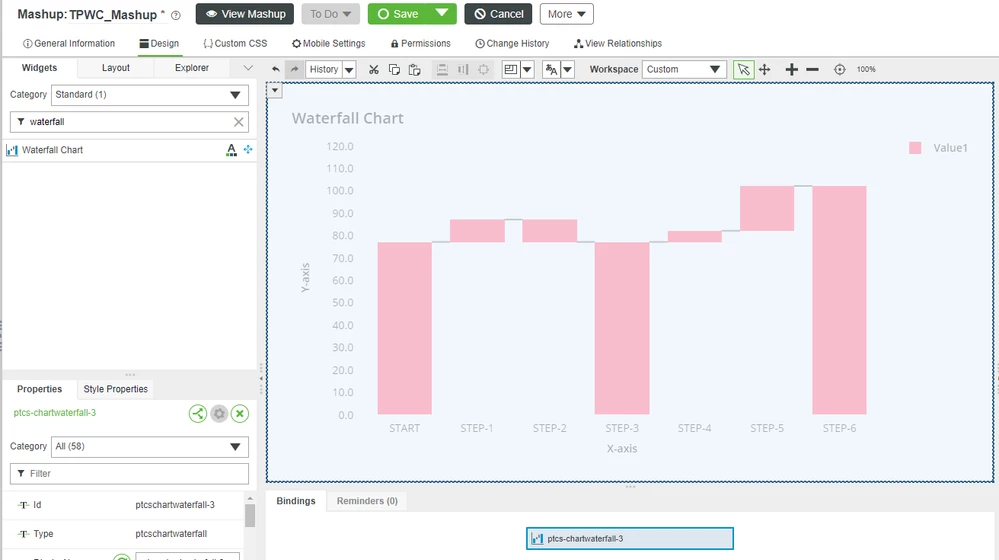
- At the top, click Save.
Click here to view Part 2 of this guide.