

Track Progress with Waterfall Chart Part 2
- November 2, 2022
- 0 replies
- 394 views
Step 4: Add Data
We've added a Waterfall Chart Widget to the Mashup, but we still need to bring in backend data.
- Ensure the top-right Data tab is active.
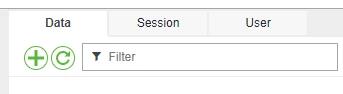
- Click the green + button.
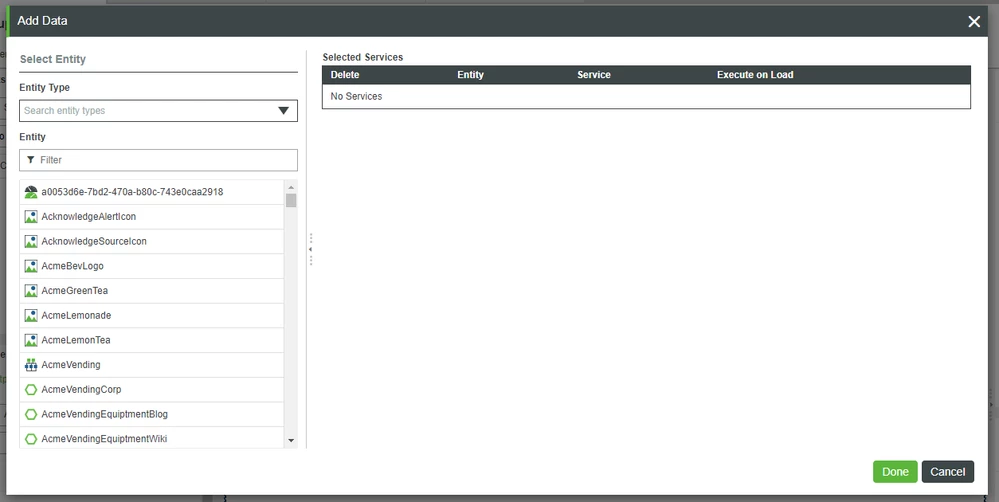
- In the Entity field, search for and select TPWC_Thing.
- In the Services field, type getprop.
- Click the right arrow beside GetProperties.
- On the right, check Execute on Load.
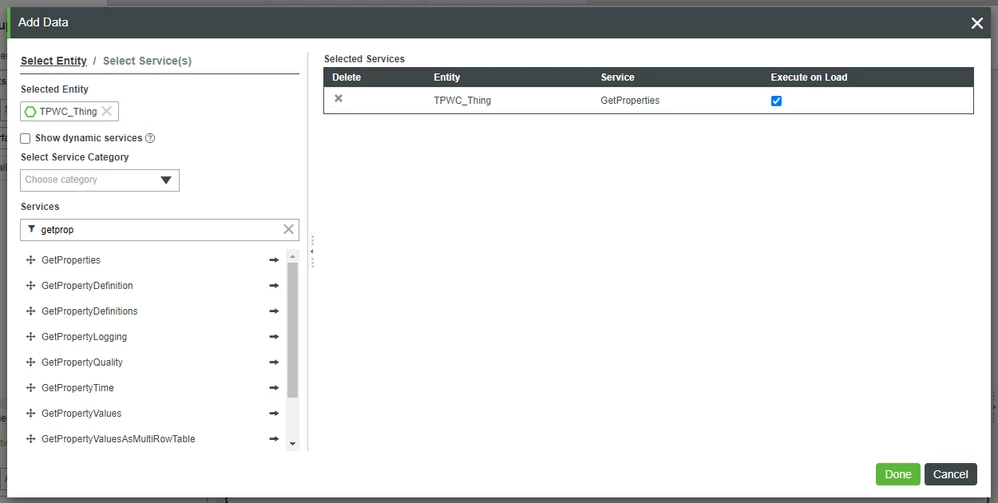
- In the bottom-right of the pop-up, click Done.
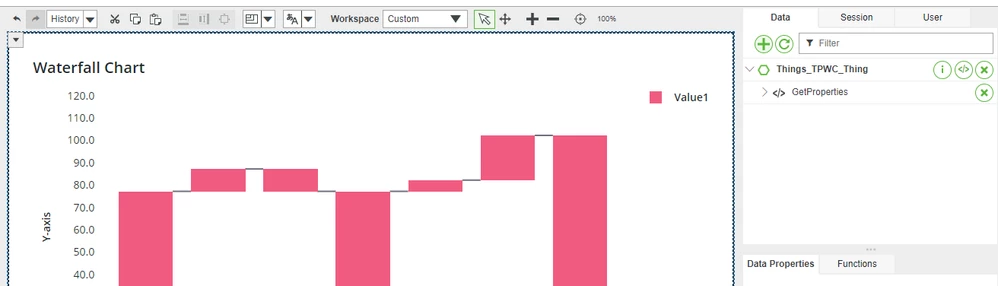
- Under the Data tab on the right, expand GetProperties.
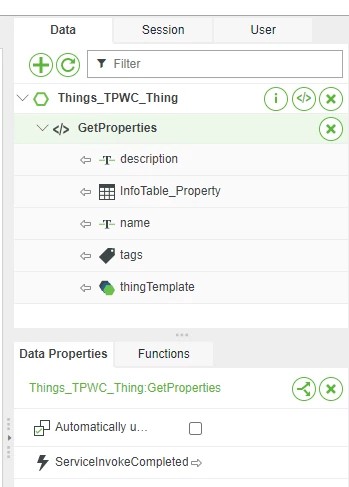
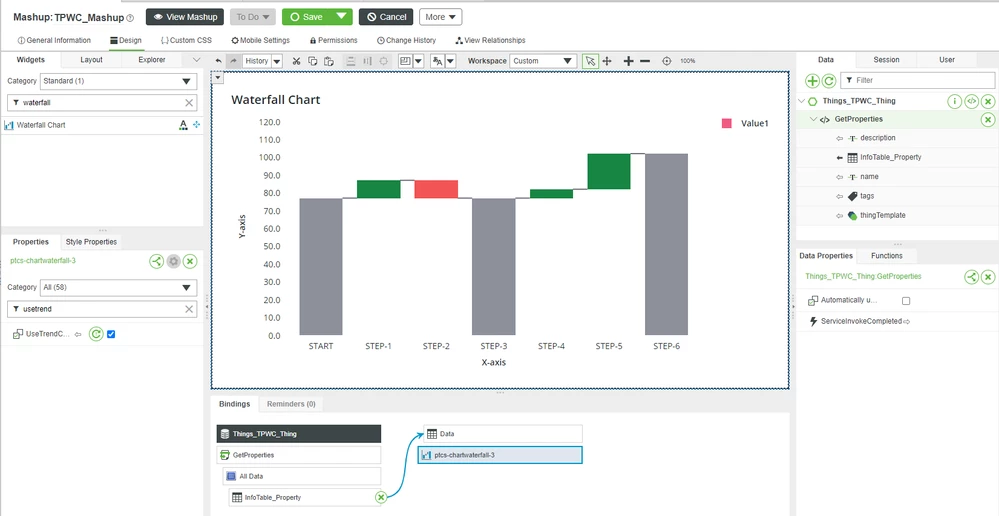
- Drag-and-drop Things_TPWC_Thing > GetProperties > InfoTable_Property onto the Waterfall Chart.
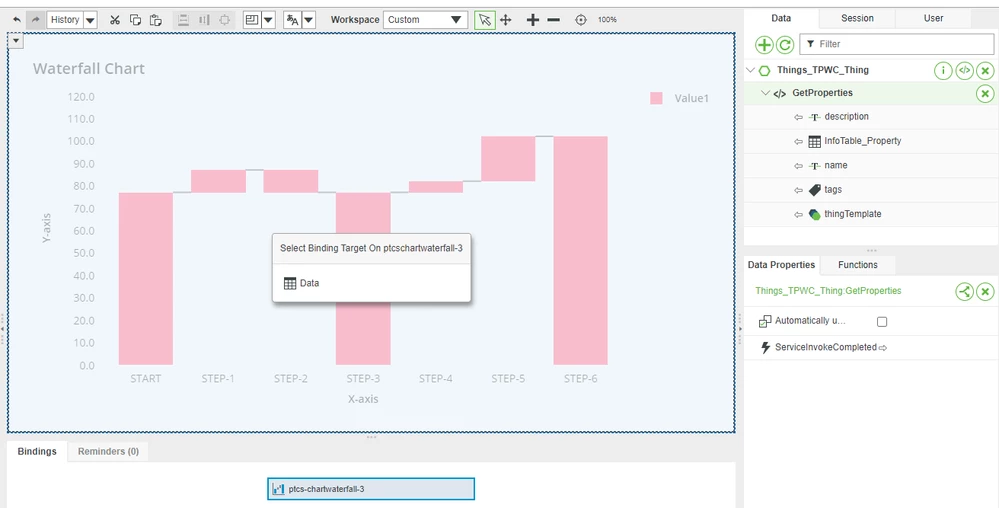
- On the Select Binding Target pop-up, click Data.
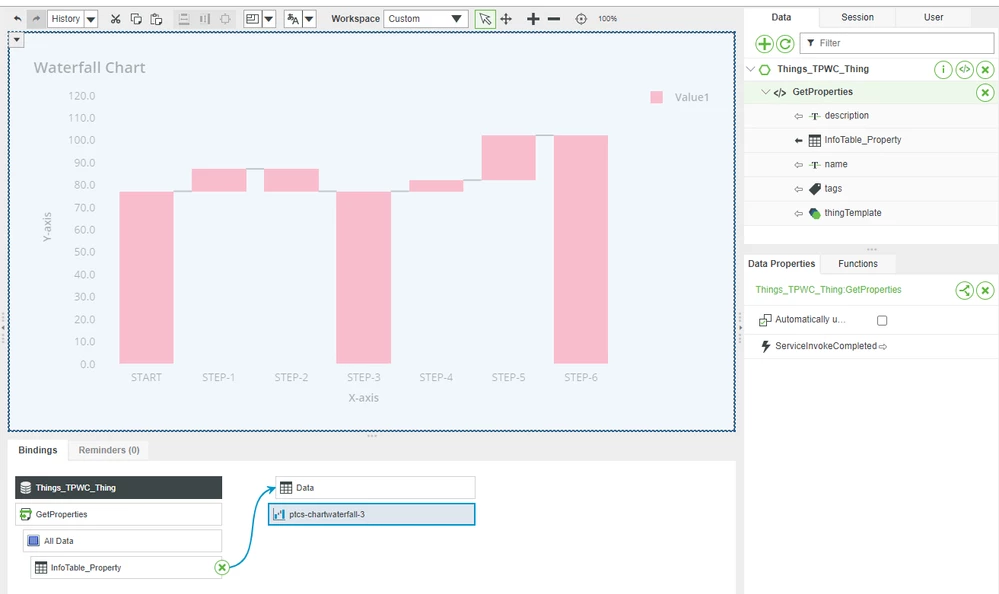
Widget Properties
With the Waterfall Chart bound to data, we now just need to configure a few of the chart's Properties.
- With the Waterfall Chart selected in the central Canvas area, ensure the Properties tab is active in the bottom-left.
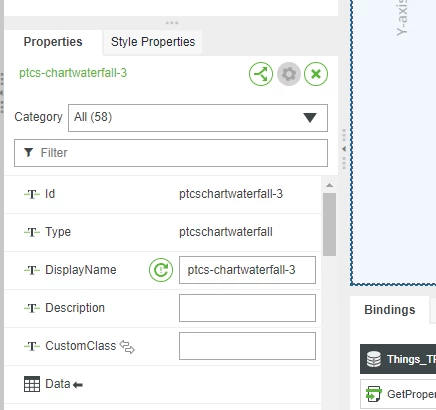
- In the Filter field, type xaxis.
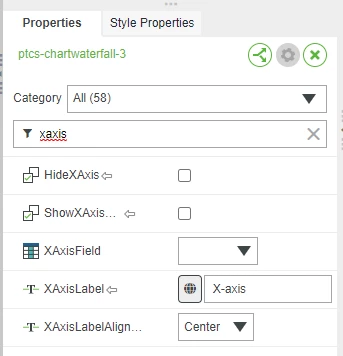
- In the XAxisField, search for and select month.
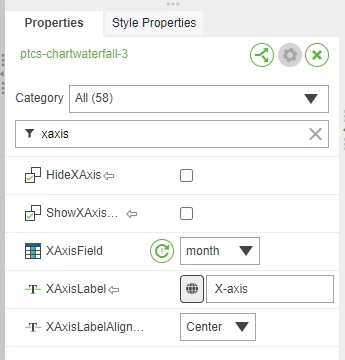
- In the Filter field, clear the xaxis search and then start a new filter with usetrend.
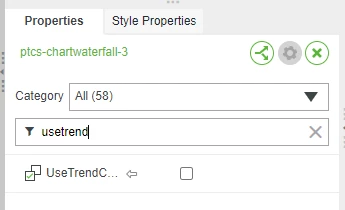
- Check the UseTrendColors box.
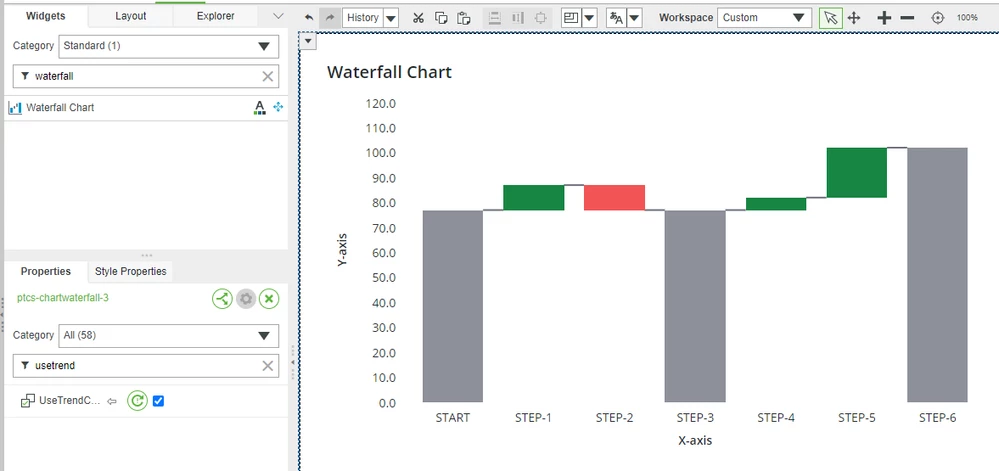
- At the top, click Save.
Step 5: View Mashup
Up to this point, we've created a Data Shape to format the columns of an Info Table Property. You then created a Thing, as well as an Info Table Property formatted by the Data Shape. As a test, you added some manually-entered data to the Info Table. After creating a Mashup, you added a Waterfall Chart Widget and tied it to that backend data.
The only thing left to do is to visualize your GUI.
- Ensure that you're on the Design tab of the TPWC_Mashup.
- At the top, click View Mashup.
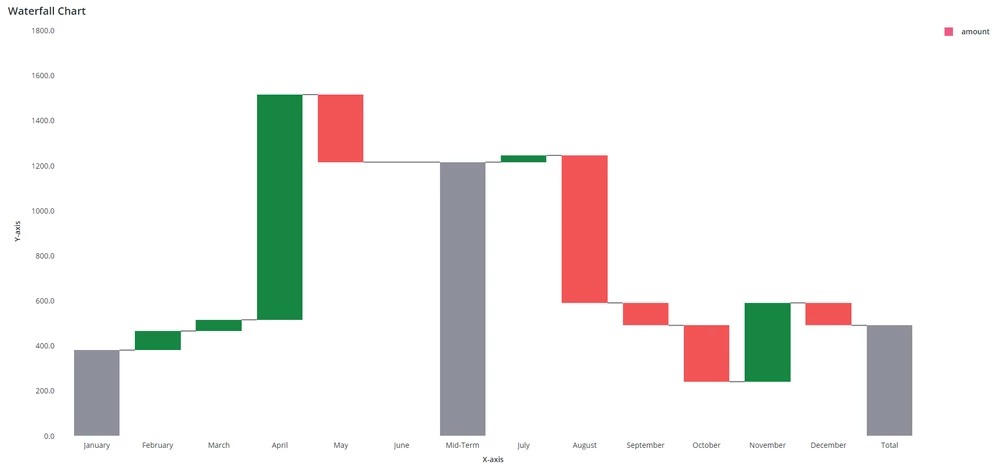
The end result is a visualization of burn up/down as the project is first defined and then implemented.
Step 6: Next Steps
Congratulations! You've successfully completed the Track Progress with Waterfall Chart guide, and learned how to:
- Create a Data Shape
- Create a Thing
- Create an Info Table Property
- Populate an Info Table with appropriate data for a Waterfall Chart
- Create a Mashup
- Utilize a Waterfall Chart to display project progress
Learn More
We recommend the following resources to continue your learning experience:
| Capability | Guide |
| Manage | How to Display Data in Charts |
Additional Resources
If you have questions, issues, or need additional information, refer to:
| Resource | Link |
| Community | Developer Community Forum |
| Support | Waterfall Chart Help |