Here is a slightly modified sheet.
1) The fit uses the fixed width FWHM now and adjusts only two parameters (position and height).
2) The data used for the fits is limited to the surrounding of the peaks, so the data of the second peak does not influence the fitting for the first peak and vice versa.
However, the peaks of the data points usually do not exactly coincide with the apex of the Gaussian shape. My goal is to find the apex of the Gaussian shape which is the "actual peak" and usually is slightly different from the peak that data points show. |
The values you are searching for are exactly the first two values of the optimized parameters (position and height). So you don't even need maximize to find the max value.
Your brilliant example program force the apex of the Gaussian shape to be at the peak of the data points. |
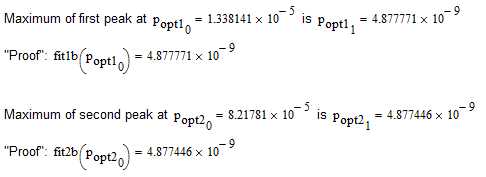
This was just done in the first example (fit1 and fit2) which actually aren't fits at all as I simply create a Gaussian with the known width at the location of the data point peak.
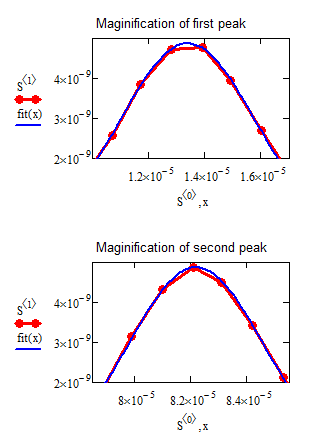
This worked pretty well (by visual inspection) for the second peak, but not that good for the first. So I used genfit to optimize the parameters for the Gaussian to better fit the data. This resulted in a better fit and now the peak is NOT at the position of a data point (see the magnification of the peak). In my first sheet this fitting would also change the peak width slightly while in this new one it doesn't.
In my new appraoch here, only position and height are fitted, I am doing it for both peaks (--> fit1b, fit2b) und you can immedeatly tell the postion of the peaks by looking at the optimized parameters.