Its funny but now we are back to where you started from - Prime 😉
Unfortunately Mathcad 15 does not offer a way out of the box to add a legend to a contour plot. This is one of the few improvements in Prime. On the other hand, in Prime you have not much control over the colors used (in Mathcad you can provide your own color map) but can just chose among a handful. Also I don't think that you can add your parabola in the Prime plot.
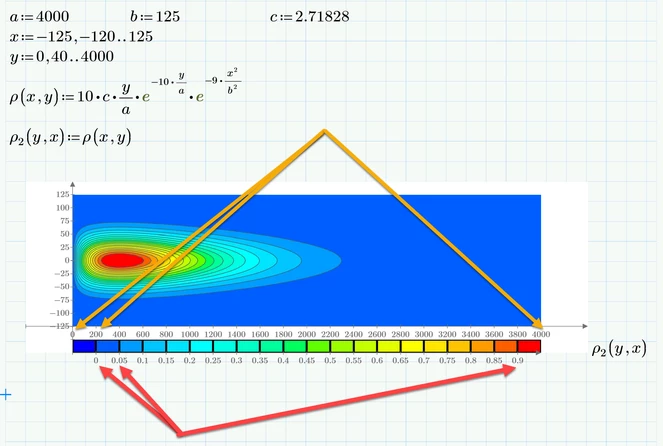
Anyway, for whatever it may be worth - here is what Prime can do for you. You may also notice that on contrary to a surface plot you are able to stretch the contour plot (isolines plot) the way you demanded. I added the arrows to show which values you can change directly in the plot to have more control over the number of isolines, etc. basically the first, second and last value in every scale.
I used the Prime file you posted in your initial thread. I would prefer the approach with "CreateMesh" but in this file I didn't change your approach with the range variables and of course they work OK, too.
Of course its possible to add a legend in Mathcad, too, but you have to create it yourself. Basically you add a second contour plot of a simple plane and have to take care to use the same color map and the same max and min z-values in both plots.
The need for a legend in contour plots resulted in a lot of questions for them in this forum quite a while ago. I attach one of my answer files (could't find the thread it stems from) with a possible solution.


