It took me a couple of seconds to work out why Tetsuro's phase plot looks different to yours - it's the linear vs logarithmic x-axis.
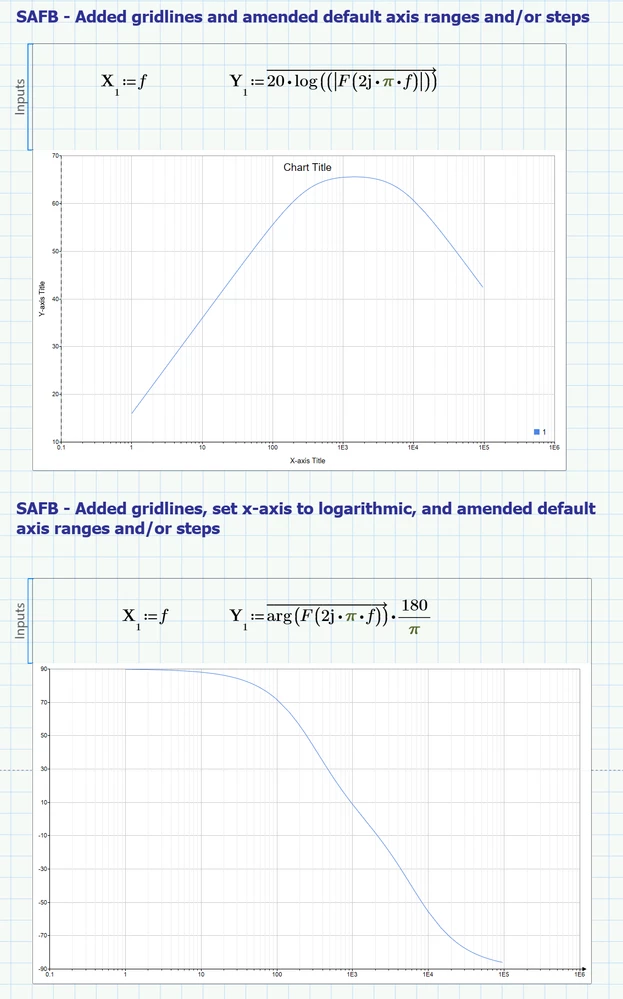
To add my minor tuppence worth, I've modified your phase plot, removed the symbols, and added gridlines (I believe they're normally shown in Bode Plots?). I didn't necessarily like the auto-scale's choice of min/max values and steps, either.
It took me a couple of seconds to work out why Tetsuro's phase plot looks different to yours - it's the linear vs logarithmic x-axis.
To add my minor tuppence worth, I've modified your phase plot, removed the symbols, and added gridlines (I believe they're normally shown in Bode Plots?). I didn't necessarily like the auto-scale's choice of min/max values and steps, either.
It took me a couple of seconds to work out why Tetsuro's phase plot looks different to yours - it's the linear vs logarithmic x-axis.
Correct. All I edited was the vectorization and I left the original of @FC_10037391 otherwise unchanged. Actually I avoid opening the chart component because its so slow and awkward to use.