1-Visitor
March 12, 2019
Solved

Ploting a closed curve with determined nodes

  • March 12, 2019
  • 11 replies
  • 5352 views

Hello everyone, I have determined 12 points individually (2D). I want to plot a closed curve between these nodes and I want to have many nodes on this pattern?


I drew an example sketch and uploaded as adding.


Apart from this, I have serious lack of education on MathCad. I need a library that I can follow each sections. I  got sick of searching everything in Google. Could you suggest me a platform?

Best answer by Werner_E

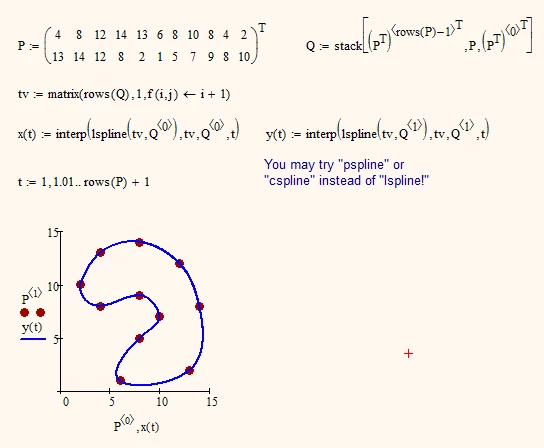
Here is a quick and not quite elegant hack using Mathcads built-in splines. Would it help?

B.PNG

11 replies

23-Emerald I
March 12, 2019

Unless you have an idea of how to describe the relationship that defines these nodes this is going to be a long, torturous path:

  • If you need a plot of y(x) vs x the existence of different values of y for the same value of x is going to be problematic.  You need to "parameterize" the problem, plot x(z) vs y(z) where z is a linearly valued parameter.  (You can plot a full circle as x(r,q) := r cos(q) and y(r,q) := r sin(q), with 0<q< 2 pi.)
  • What the parameterized equations might be for your data is the challenge.  If you know the forms of the expressions, Mathcad can find the values of coefficients that form a "best fit."
25-Diamond I
March 12, 2019

Just 12 points? Hope you also know the order they have to be connected. You might want to look up the theory behind Bezier curves.

And no, it has nothing to do with an ellipsoid, which is a three-dimensional body and it seems all you are asking for is to connect or approximate your points with a two-dimensional smooth closed curve.


tasdemirg1-VisitorAuthor
1-Visitor
March 12, 2019

You're totally right. I edited post. I don't know why I just stuck with the wrong word. It's not even eliptical. It's like all you say: "a two-dimensional smooth closed curve"


21-Topaz II
March 12, 2019

Hi,


What you need is a cubic spline curve.

Between each pair of nodes equation is Ax^3+Bx^2+Cx+D having unique A,B,C,D

value of x and y common at the nodes

value of dx/dy same each side of nodes for matching slope

value of d2x/dy2 same each side of nodes for a smooth transition between curves


For 12 points have 12 lines each A,B,C,D for 48 unknowns

There 24 equations for x and y at the ends.

There are 12 equations for equal derivative at 12 points.

There are 12 equations for equal second derivative at 12 points.


The solution for the 48 unknowns can be done.

This can be set up in a matrix format.to solve for the ABCD's.

When they are known the figure is defined for all x,y on the curve.


Here is one prepared earlier that starts and stops away from each other.  You give it end slopes at ends.  It was used in real life to analyse roller coasters through designated points.  It needs adjusting for closed ends..


Cheers

Werner_E25-Diamond IAnswer
25-Diamond I
March 12, 2019

Here is a quick and not quite elegant hack using Mathcads built-in splines. Would it help?

B.PNG

tasdemirg1-VisitorAuthor
1-Visitor
March 12, 2019

This look pretty simple and nice.Thanks a lot really. I was eating my mind with the previous solution above. It works out for me if only I can attend extra nodes on this curve.


How do we create nodes automatically on curves? Let's say I'd like to have 50 nodes on the curve.


I need to have matrix that contains nodes on this curve in order to put in an equation.

23-Emerald I
March 13, 2019

@tasdemirg wrote:

How do we create nodes automatically on curves? Let's say I'd like to have 50 nodes on the curve.


Werner has created a parametric graph--- functions x(t) and y(t).  These will give a value of x and y (a node) for any value of t.