

1-Visitor
April 3, 2017
Solved

Display Data on Mashup Composer, from remote devices

  • April 3, 2017
  • 16 replies
  • 6022 views

Hello,

I successfully simulated my computer as several device, sending simulated data, generated from the Lua Script Agent running there, to the ThingWorx platform.

You can see on this first screen one of my device, with inside 3 parameters :

- AirHumidity

- FloorHumidity

- Temperature

which are updated automatically with the wsems and luascript running on my computer, as you can see on the screen below.

10825cddbff17ad573147f9c1f249bf1.png

When i created my mashup, as i did during the first tutorial which works well, this time i had no data displayed.

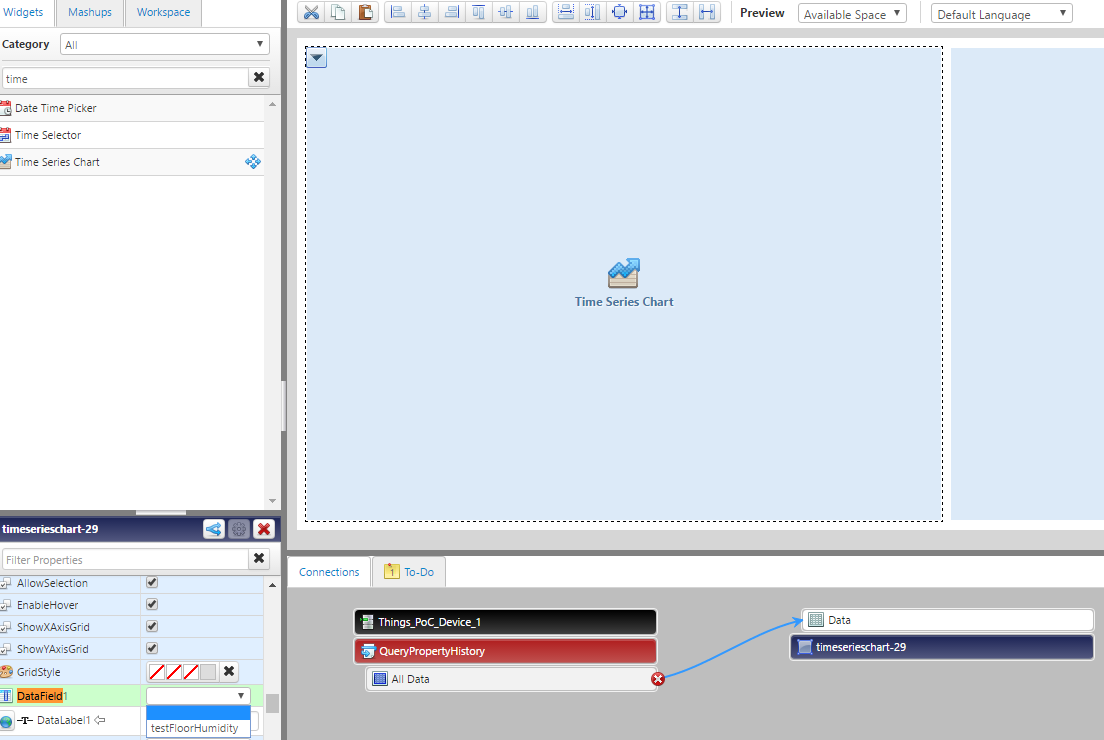
To be sure of what happened, i decided to try something with the Time Series Chart, and if you look on the

bottom left of the screen below, on the DataField1 section, you will only see the local property testFloorHumidity, and not the other properties, catched from remote device.
effb31d9b598c286d57297576aca6308.png

My question is, how can I do to display data from remote device on Mashup Composer ?

Cheers,

Best answer by dupatel

Jordan Goasdoué​ : The issue seems to be that you have not logged the below properties:

- AirHumidity

- FloorHumidity

- Temperature

To fix it , edit the property and tick logged.

After doing this you should see the property values from your remote device.

-Durgesh

16 replies

dupatel5-Regular MemberAnswer
5-Regular Member
April 4, 2017

Jordan Goasdoué​ : The issue seems to be that you have not logged the below properties:

- AirHumidity

- FloorHumidity

- Temperature

To fix it , edit the property and tick logged.

After doing this you should see the property values from your remote device.

-Durgesh

5-Regular Member
April 4, 2017

Hi Jordan Goasdoué​,

To add what Durgesh mentioned; the TimeSeries shows only Series Data.

If we are not logging the Property; there will no Series created for that property. Also, the QueryPropertyHistory Service won't even have that coumn as output.

So, we need to log the Data to show it in the Chart.

Thanks,

Ankit Gupta

1-Visitor
May 5, 2017

Hi Ankit Gupta​, Jordan Goasdoué​,

I have similar kind of issue. I have a value stream for my remote thing. When I test the QueryPropertyHistory I see the result as below.

Prop_yaxisProp_xaxistimestamp

-0.051

-0.251

2017-05-05 11:15:10.251

-0.029

-0.256

2017-05-05 11:15:10.181

-0.178

-0.093

2017-05-05 11:15:09.941

-0.093

-0.056

2017-05-05 11:15:09.679

-0.063

-0.161

2017-05-05 11:15:09.628

0.0

-0.12

2017-05-05 11:15:09.365

-0.095

-0.015

2017-05-05 11:15:09.296

-0.237

-0.071

2017-05-05 11:15:09.257

-0.103

-0.134

2017-05-05 11:15:09.018

I want to show these data on timeseries chart. So binded ALL Data from returned data to timeseries chart, the DataField1 and DataField2 are empty here which is causing no data to be displayed when I view the mash up.

Thanks,

Azim

5-Regular Member
May 5, 2017

Hi azim hawaldar​,

What is the DataType of Prop_yaxis and Prop_xaxis?

Are you seeing anything in the dropdown for DataField1 and DataField2?

1-Visitor
April 4, 2017

Thank you for both your answers, it fixes my problem.

Cheers !
