Solved
issue with the logic and plotting the results over the chart
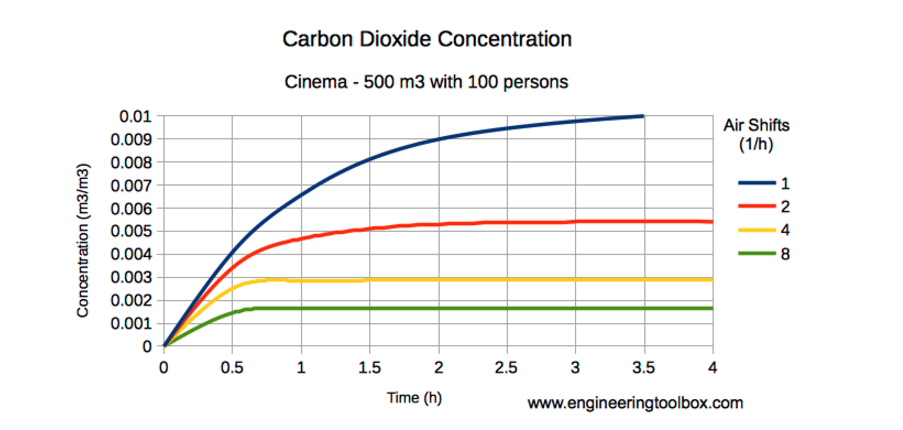
I have a doubt in how to come up with the logic to calculate the below scenario and plot it on some chart as shown below
my output is to calculate concentration
i have to supply inputs . I found a way to calculate the inputs
please and kindly someone tell me the way to plot such chart