

1-Visitor
March 14, 2017
Solved

number of elements stored in a value stream

  • March 14, 2017
  • 2 replies
  • 3808 views

Hello

I am recording data since several weeks but I can only display one or two days of data using a graph and "time picker" widget for start and end date selection.

(I'm using a postgres database)

Is there a limit of history for the data when using value stream to log them? Is it configurable or do I have an issue with my graphs ?

Thanks

Pascal
    Best answer by ankigupta

    Hello,

    We can set the default values by clicking on the Service in the Mashup Builder. It will show the Parameters at the Bottom.

    As per my knowledge; there is no inbuilt advanced Service to get average data per Hour. But we have the possibility of writing our own Services and use Query to filter data and also we can use Snippets like average for getting the average as per our requirement etc.

    Also, if you are on the latest version of ThingWorx; you can download the new Charts (Charts version 2) from the ThingWorx marketplace. They are more advanced charts and load faster.

    I hope it helps.

    2 replies

    20-Turquoise
    March 14, 2017

    Hi,

    You should be abe to display data without any time limitations, especially such strict ones as only 2 days.

    Value streams only "limitations" are defined as such:

    • For total storage size in the system
      • The Stream/ Value Stream automatically saves the data in the persistence provider, it depends on which database was used
      • Neo4j, a smaller database, recommended below 50Gb storage size for optimal performance
      • PostgreSQL, a useful and powerful database, performs well up to an estimated 500 Gb of data storage
      • DSE Cassendra, used for even higher data volume
      • H2, the size limit is 4 Tb according to the documents online, but there is no official test record in Thingworx Platform
    • For Threshold size, Maximum Block size, Queue size and Thread size
      • Please refer to CS240607 for more details
      • The article talks about how  the default values were chosen and how to configure them
    pjoly1-VisitorAuthor
    1-Visitor
    March 15, 2017

    Thanks for this information.

    I'm far away from these limits so my problem is probably decribed by Ankit below

    5-Regular Member
    March 15, 2017

    Hi pjoly​,

    Which service are you using to fetch the data from Value Stream? By Default Services fetches 500 Rows. So, you might need to increase the count as per your requirement.

    pjoly1-VisitorAuthor
    1-Visitor
    March 15, 2017

    Hello

    Thanks for your quick answer and for this information, I guess I'm displaying only 500 items in the graph.

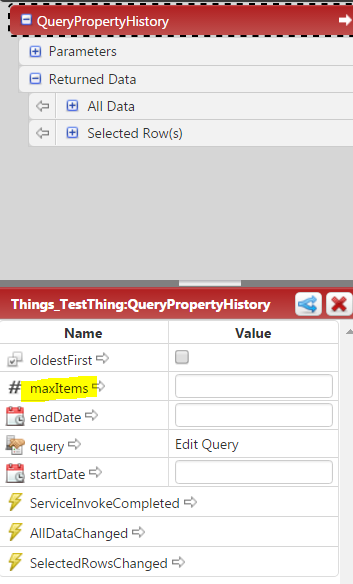
    I'm using "QueryPropertyHistory" with StartDate and EndDate from date picker widget.

    I can see maxItems in the Parameters of this function, I guess I can increase the number of values with that ? Is there an easy way to fill this query  parameter with an higher value (a constant for example) from the mashup builder ?

    In order to limit the number of points to display in the graph (already a little bit slow to refresh) , is there advanced services to fetch oldest data such as average values per hours, and after per days, per weeks, etc ...as we can see in some graphical tools ?

    Pascal

    ankigupta5-Regular MemberAnswer
    5-Regular Member
    March 15, 2017

    Hello,

    We can set the default values by clicking on the Service in the Mashup Builder. It will show the Parameters at the Bottom.

    As per my knowledge; there is no inbuilt advanced Service to get average data per Hour. But we have the possibility of writing our own Services and use Query to filter data and also we can use Snippets like average for getting the average as per our requirement etc.

    Also, if you are on the latest version of ThingWorx; you can download the new Charts (Charts version 2) from the ThingWorx marketplace. They are more advanced charts and load faster.

    I hope it helps.